== meLorean writeup ==
== Description ==
There was a crazy Data Scientist who rectilinearly claimed mathematics can make miracles.
He left a note and then disappeared. Help to decode it.
== Input data ==
(you can find whole data set here)
$ head dataset.txt
[(148, 13024.96),(236, 19034.88),(19, 1817.0),(202, 16665.88),(2, 414.12),(41, 3643.0),(67, 5801.0),(231, 19024.74),(219, 18785.34),(214, 16921.88),(207, 18117.84),(187, 15761.0),(136, 11528.0),(0, 240.0),(85, 7295.0),(6, 723.24),(223, 19498.96),(9, 927.78),(238, 19994.0),(177, 14931.0),(130, 11250.6),(69, 5967.0)]
[(159, 10955.82),(16, 1136.8),(152, 10272.0),(121, 7867.2),(190, 13587.08),(155, 10473.0),(128, 9183.84),(191, 12627.3),(149, 10272.42),(215, 14493.0),(89, 6293.04),(101, 6855.0),(233, 15699.0),(228, 15364.0),(32, 2232.0),(33, 2299.0),(1, 155.0),(81, 5294.4),(247, 16969.74),(230, 15188.04),(120, 8128.0),(243, 15714.24)]
There are 25 lists each looking like this. Every list has 22 elements. Every element has 2 items. First thing that came to my mind were xs and ys.
I noticed that x is never bigger than 255 and never smaller than 0. Xs always were integers.
The number "255" caught my attention because it's the biggest number that can represented by 8 bits. Later on it turned out to be a rabbit hole.
On other side ys always were floats.
== Solution ==
Because description mentions data science my first thought was to create a plot for each x and y for all 25 lists.
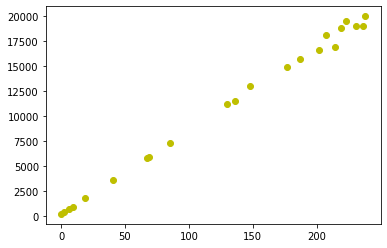
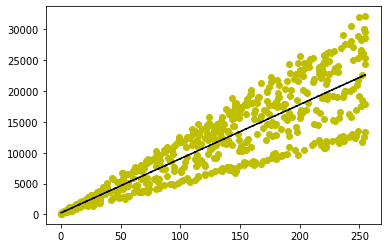
figure (1) for first list in a dataset
figure (2) data from all lists in a dataset combined
Seeing this plot made something click in my mind and think of linear regression At this point I was wondering what exactly am I looking for. Maybe each list generates pattern of a letter... well, that would be very data scientifc approach. There is 25 lists in a dataset. Let's assume that every list corresponds a character in a flag. The flag format was SCTF{...}. Decimal for "S" is 83. So from first list we should somehow extract ~83. After reading the article. I implemented all of the formulas to match my values, but none seemed to return a wanted value. Trial and error brought me to the point where I implemented the function named smol_sqr(x,y) Jupyter notebook with code. Let's decode first letter. The function takes two arguments \(x\) and \(y\) which are supposed to be arrays with all xs and ys from a one of the 25 lists in a dataset. Let's calculate arithmetic mean for \(x\) and \(y\) arrays. \begin{align*} \bar{x}=&\frac{x_1+x_2+\dots+x_{n}}{n},\\ \bar{y}=&\frac{y_1+y_2+\dots+y_{n}}{n}. \end{align*} With that we can calculate \(a\) and \(b\) estimates. \begin{equation}\label{estymatory} \hat{a}= \frac{y_1(x_1-\bar{x})+y_2(x_2-\bar{x})+\dots+y_n(x_n-\bar{x})} {(x_1-\bar{x})^2+(x_2-\bar{x})^2+\dots+(x_n-\bar{x})^2},\\ \quad\hat{b} =\bar{y}-\bar{x}\hat{a}, \end{equation} In smol_sqr() function we are doing that with a for loop to calculate the \({\hat {a}}\)'s numerator and denominator and after loop exits we devide them by each other. For values: x = [148, 236, 19, 202, 2, 41, 67, 231, 219, 214, 207, 187, 136, 0, 85, 6, 223, 9, 238, 177, 130, 69] y = [13024.96, 19034.88, 1817.0, 16665.88, 414.12, 3643.0, 5801.0, 19024.74, 18785.34, 16921.88, 18117.84, 15761.0, 11528.0, 240.0, 7295.0, 723.24, 19498.96, 927.78, 19994.0, 14931.0, 11250.6, 5967.0] This is the result: (82.6079979389731, 284.766266621933) Hence \({\hat {a}}=82.6079979389731\) and \({\hat {b}}=284.766266621933\). Rounding the \(82.6079979389731\) to the nearest integer gives us \(83\). Let's throw it in python. Python 3.8.10 (default, Sep 28 2021, 16:10:42) [GCC 9.3.0] on linux Type "help", "copyright", "credits" or "license" for more information. >>> chr(83) 'S' >>> It worked! Great. Now let's create a loop that will do all of that for every list in a dataset.